
The KC Concrete Settlement Risk Index
Why does concrete sink here? We combined three free government datasets — county soil chemistry, winter freeze-thaw cycles, and the city's own 311 sidewalk reports — into one honest picture of settlement risk across the Kansas City metro. Every number links to its source.
What the KC Concrete Settlement Risk Index measures
The KC Concrete Settlement Risk Index scores why concrete sinks across the Kansas City metro by combining three free public datasets: USDA soil shrink-swell ratings by county, NOAA freeze-thaw cycle counts at Kansas City International, and Kansas City 311 sidewalk-and-curb complaints. More clay movement and more freeze-thaw days mean more voids opening under your slab.
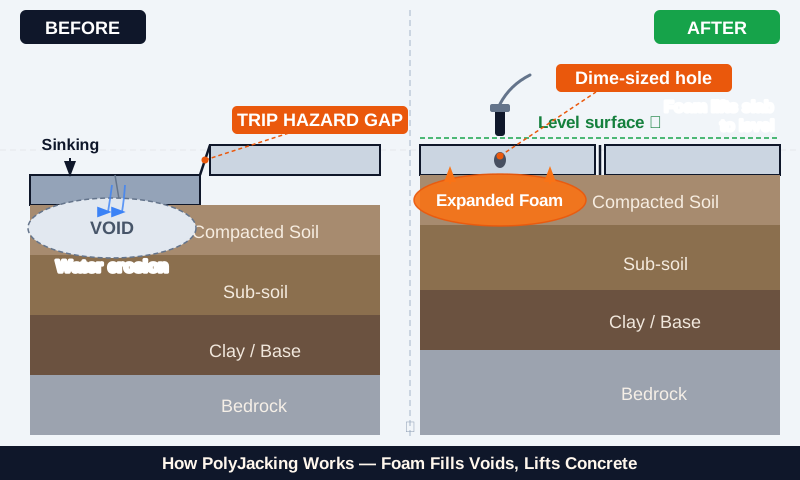
Concrete rarely sinks at random. Across the Kansas City metro three forces do most of the damage: expansive clay that swells and shrinks with moisture, freeze-thaw cycles that push and release water under the slab every winter, and the slow washout of soil through drainage and joints. The first two can be measured directly from public data — so we did, county by county and winter by winter. This page is that measurement, not a sales pitch: where the numbers say risk is lower, we say so.
Which KC-metro counties have the most settlement-prone soil
Miami County leads the metro, with about 85.8% of its mapped soils rated High-to-Very-High shrink-swell, followed by Johnson County at 77.7% and Cass at 75.0%. These expansive clays swell when wet and shrink when dry, prying open voids beneath driveways, patios and garage floors. Every figure below comes straight from USDA SSURGO survey data.
Schematic county layout — arranged roughly Kansas (west) to Missouri (east), not to geographic scale. Shading = share of each county's USDA-mapped soils rated High-to-Very-High shrink-swell.
KC-metro counties by shrink-swell soil share
| County | High / Very-High soils | Risk band |
|---|---|---|
| Miami County, KS | 85.8% | Very High |
| Johnson County, KS | 77.7% | Very High |
| Cass County, MO | 75.0% | Very High |
| Clay County, MO | 65.5% | High |
| Atchison County, KS | 61.7% | High |
| Leavenworth County, KS | 61.0% | High |
| Douglas County, KS | 51.3% | Moderate-High |
| Wyandotte County, KS | 43.1% | Moderate |
| Jackson County, MO | 43.0% | Moderate |
| Platte County, MO | 35.0% | Lower |
| Lafayette County, MO | 24.6% | Lower |
How Kansas City's freeze-thaw cycle moves your slab
A freeze-thaw day happens when the temperature crosses 32 degrees — freezing overnight, thawing by afternoon. Water trapped under your slab expands about 9 percent each time it freezes, then leaves a void when it melts. Kansas City International averages 79.6 such days per winter across NOAA station records kept since 1995.
Freeze-thaw days per winter at Kansas City International, 31 seasons since 1995 (NOAA / ACIS). A freeze-thaw day = overnight low at or below 32°F and daytime high above it. Winter 2025-26 (highlighted) logged 63; the range runs 53 to 100, averaging 79.6.
Kansas City clay: why it swells and shrinks under concrete
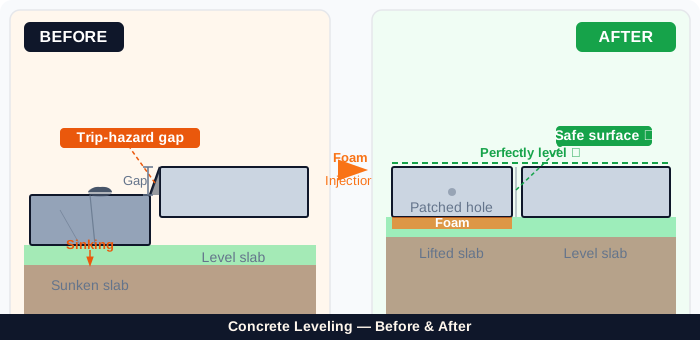
Kansas City sits on Wymore-Ladoga clay, a smectite-rich soil that can expand 10 to 15 percent in volume when saturated and contract as it dries. With roughly 40 inches of rain arriving unevenly each year — wet springs, dry falls — that cycle repeats season after season, lifting and then dropping the concrete resting above it.
The metro's dominant residential soil is the Wymore-Ladoga clay complex — a smectite (montmorillonite) clay that behaves almost like a sponge. Saturate it in a wet spring and it swells, lifting whatever sits on top; dry it out in late summer and it contracts, opening a gap the slab eventually drops into. That is the engine behind most sunken driveways, patios and garage floors in Kansas City, and it is exactly what the county soil ratings above are measuring.
What Kansas City's 311 sidewalk reports reveal
Since 2021, Kansas City residents have filed 10,524 sidewalk-and-curb requests through the city's 311 system, and the full-year count has climbed from 1,498 toward 2,262. These figures cover the City of Kansas City, Missouri only — suburbs run separate systems, so this index never applies Kansas City counts to them.
Full-year “Sidewalks and Curbs” 311 requests, City of Kansas City, MO (open-data portal d4px-6rwg). Of the 10,524 total logged since 2021, 5,468 are “Damaged Sidewalk” and 2,459 are “Curb Repair or Replacement.”
The February KC Freeze-Thaw Damage Index
Each February, once winter damage becomes visible, we recount the season's freeze-thaw days at Kansas City International and rank them against three decades of NOAA records. The 2025-26 winter logged 63 freeze-thaw days — a milder year near the low end of the 53-to-100 range. We publish the ranking so residents can track the trend.
Freeze-thaw damage shows up in late winter, right when homeowners start noticing new cracks and drops. So each February we recompute the season's freeze-thaw count at KCI from NOAA's daily records and rank it against every winter back to 1995. It is a simple, repeatable public-interest number — the kind of local weather-damage statistic Kansas City residents, reporters and realtors can cite. The current reading and full history live on this page and update every year.
How we built this: sources and methodology
Every number on this page traces to a free public dataset with a live link below: USDA Soil Data Access for shrink-swell ratings, NOAA's regional climate service for freeze-thaw counts, and Kansas City's open-data 311 portal for complaint trends. Nothing here is estimated or borrowed — you can reproduce every figure yourself.
USDA soil shrink-swell
County soil ratings come from the USDA/NRCS SSURGO survey, queried through Soil Data Access. We measure the area-weighted share of each county's mapped soils whose dominant component has High or Very-High linear extensibility (lep ≥ 6.0) in the upper 100 cm.
sdmdataaccess.sc.egov.usda.gov →NOAA freeze-thaw counts
Freeze-thaw days are computed from daily high/low temperatures at Kansas City International (station KMCI / GHCND USW00003947) via NOAA's Applied Climate Information System. A freeze-thaw day = min ≤ 32°F and max > 32°F, counted per winter since 1995.
data.rcc-acis.org (KCI) →Kansas City 311
Sidewalk and curb complaint counts come from the City of Kansas City's open-data portal (“311 Call Center Reported Issues,” dataset d4px-6rwg), filtered to the “Sidewalks and Curbs” issue type. This dataset is live and covers the City of Kansas City, MO jurisdiction only.
data.kcmo.org →Figures on this page are as-of 2026-07-11. The 311 and soil datasets are live and grow over time; freeze-thaw is recomputed each winter. We publish the query behind every number so anyone can reproduce it.
Find out what's moving under your slab
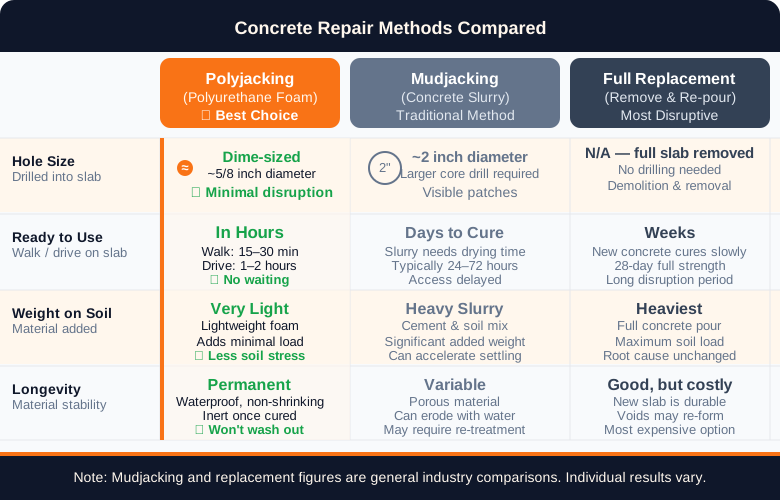
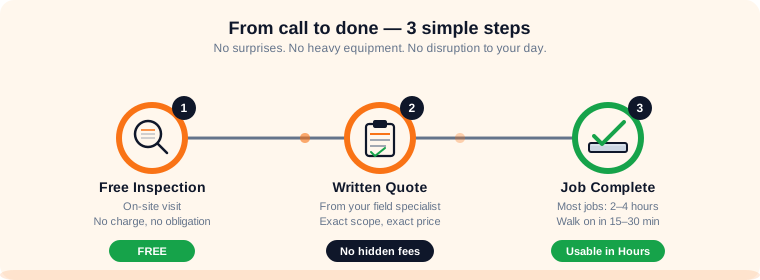
The data explains why concrete sinks across the metro. A free on-site inspection tells you what's happening under your driveway, patio or garage — and whether foam leveling is even the right fix.
Booking is handled by our online scheduler just below. No obligation — if foam isn't right for your slab, we'll tell you straight.
Related guides
Pick a time that works for you
Book right here on this page. Prefer to talk? Call (913) 713-7794.